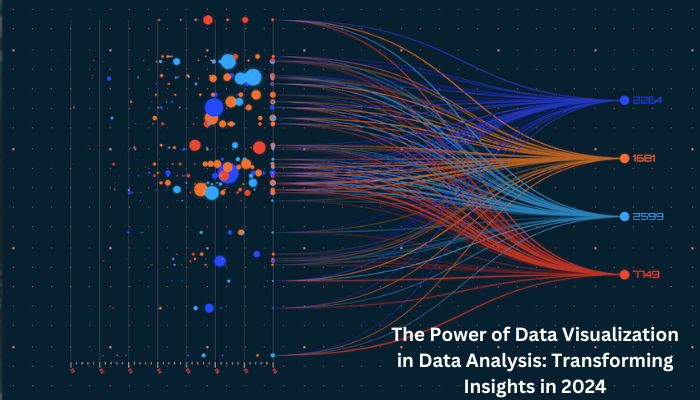
Data visualization transforms abstract data into intuitive visual formats, such as charts, graphs, and maps, to make it easier to understand and analyze. Its primary goal is to communicate insights from data clearly and effectively. This blog will explore various data visualization tools and techniques, including Tableau, Power BI, and Excel, and how to use charts, graphs, and dashboards to tell compelling stories with data. It will also discuss best practices for data visualization.
Importance of Data Visualization in Data Analysis
Data visualization is vital in data analysis, enabling analysts to understand complex information and extract valuable insights. It simplifies large datasets by providing a concise summary, reducing errors and misunderstandings. Data visualization also facilitates effective communication of findings, making it accessible to stakeholders without technical expertise.
It also fosters collaboration among individuals from different backgrounds by providing a common understanding of the data being analyzed. Furthermore, by letting users interact with the images interactively, filter certain variables, or go into the details to find undiscovered links and insights, data visualization facilitates exploratory analysis. This interactivity enhances engagement with the data and promotes deeper exploration. Overall, data visualization is a vital tool for practical data analysis and decision-making.
Tools for Data Visualization
Tableau
Tableau is an influential tool used by data analysts, statisticians, and scientists to transform data visualization and gain insights. It streamlines data preparation, cleaning, and formatting processes, making data visualization more efficient. Tableau also serves as a platform for data infrastructure and business intelligence, aiding in solving complex datasets.
Power BI
Microsoft’s Power BI tool integrates with all products and offers various visualization options, from basic charts to advanced visuals. It supports data modeling and is used by companies for intuitive interfaces and better decision-making processes. Core features include data modeling, alteration analysis, interactive dashboards and reports, and visual customization using Power BI’s custom visuals SDK. Tools like Power Query and Power Pivot provide accurate explanations for value changes. This tool helps create intuitive interfaces and better decision-making processes.
Sisense
Sisense is a popular data visualization tool that extracts data from various sources and generates insights. It offers embedded analytical capabilities and allows users to integrate with RestAPI through its interface. However, extensive training is required to use this software. The tool has core features such as ad-hoc analysis, which allows users to explore large amounts of data, create reports, and visualize collected data without specialized knowledge.
Data visualization options include graphs, dashboards, and charts. Additionally, Sisense allows data integration from various sources, including cloud services, databases, and spreadsheets, allowing for data storage and analysis.
Zoho Analytics
Zoho Analytics is a data visualization tool that aids in data preparation, exploration, and visualization. It offers various analytics solutions for tracking performance metrics, making forecasts, and making predictions. Zoho is one of the few tools with AI integration, allowing users to create data sheets and convert them into readable formats using pre-built templates. It provides insights and recommendations on ML, AI, and NPL technologies, enabling predictive analysis and future trend prediction. The tool is ideal for creating charts, dashboards, graphs, and pivot tables, with a low-code interface for beginners. It also allows users to transform and enrich data, merge data sets, perform calculations, and analyze them based on different metrics.
Qlik Sense
Qlik Sense is a data analytics tool businesses use to enhance their data exploration. It offers advanced analytics capabilities, can be deployed on-premise or in the cloud, and allows for flexible management of different data sources. Its core features include hybrid deployment, real-time data analysis, trigger automation, data monitoring, and alerts, making it a unique business platform.
Types of Data Visualizations
Data Visualization Types Overview
- Bar charts: Compare quantities.
- Line charts: Show trends over time.
- Pie charts: For proportional comparisons.
- Scatter plots: Identify relationships.
- Maps: Represent geographic data.
- Network diagrams: Represent hierarchical data.
- Advanced types: Heat maps, bubble charts, waterfall charts, Gantt charts, and Sankey diagrams.
- Choice depends on the data nature, audience, and analysis goal.
Designs for Data Visualization
Visual hierarchy is crucial in report design, highlighting essential elements through size, color, and position. Consistency in design elements, formatting, and interaction across reports is necessary. Limit visual clutter and optimize for the message, considering color-blind users’ needs. Use default chart types for familiarity, add descriptive titles and labels, and format numbers. Test on small screens like mobile phones for readability, seek feedback from reviewers, and comply with accessibility standards like WCAG.
Conclusion
Data visualization is crucial for individuals and organizations to understand data and gain strategic advantage. It transforms dry numbers into vivid stories, enabling efficient exploration, comparison, discovery, and sharing of insights. It has applications in business optimization, social causes, research, and education. With continuous innovation, data visualization will continue to revolutionize data interaction and leverage. Read More
